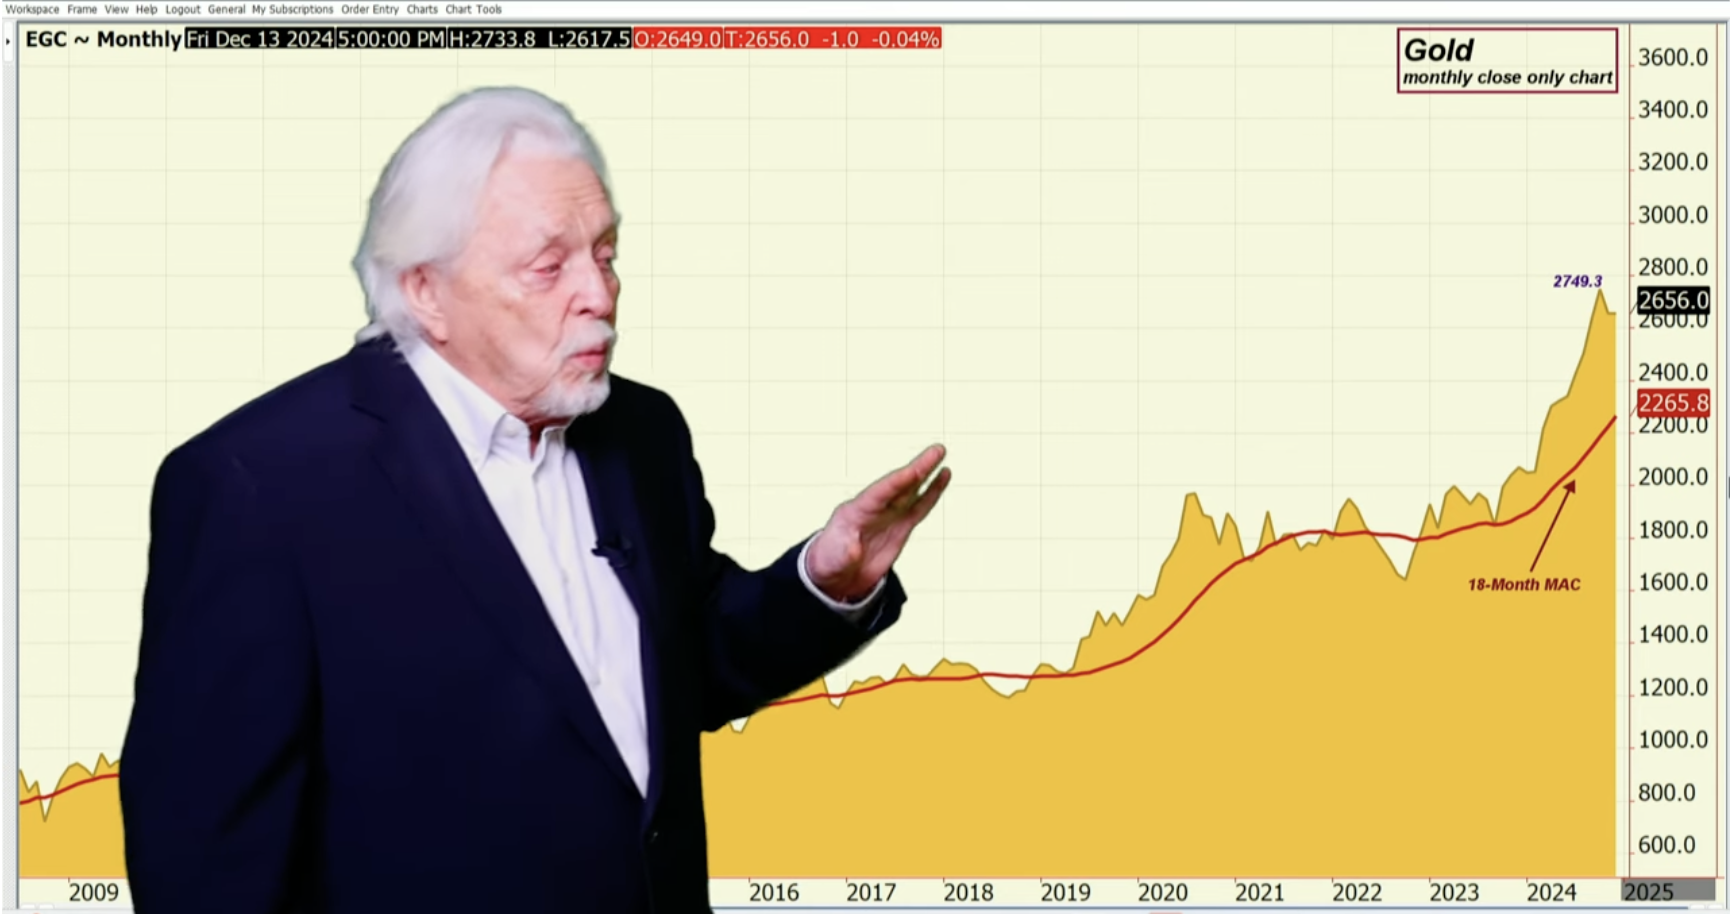
When we look at the gold market, you can see how you came up and you fell back right here. For the month, because this is the monthly chart on a closing basis, you’re down four-tenths of a percent or a dollar. When you look at the weekly chart, you are actually up nearly two-thirds of a percentage point and up $17, even though you gave a lot up on Friday. When we look at the weekly chart, I think you can look at the spike here, the break there, and you’re caught right in this.
Okay, but when I put on my swing line, I have a pattern that’s sort of interesting too. I do have higher lows and higher highs. So until the market takes this out, last week’s low, you want to be what? defensive. If it takes out last week’s low, then where’s the market go? And why am I targeting that? Because last week’s low at $2617 and a half, the 18-week average is $26-28 roughly – that’s where the support is. Take that out and you open the door up for the lower Bollinger Band, doesn’t have to go there, but you open the door for it. Right now, the bulls are trying to defend their bullish position. As I think right here, not allowing the market to get much away from the $2618 level – let’s call that.
Read the full article here

