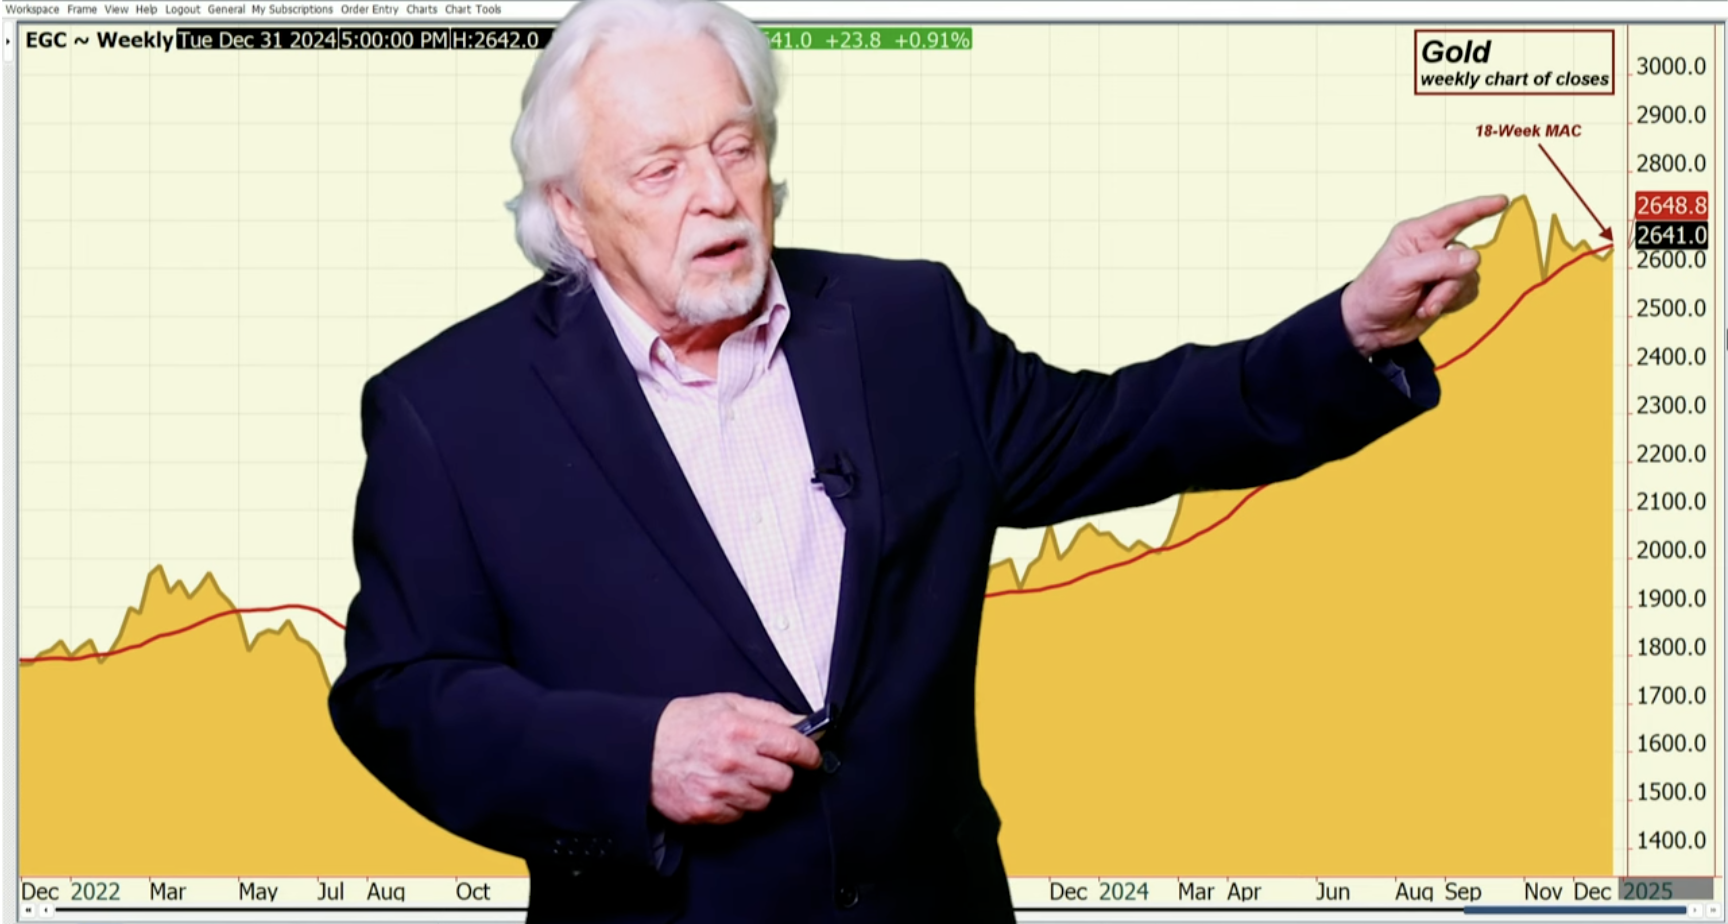
In the gold, up; other metals, down. So let’s look at the chart. The chart action, you’re fighting at the $2648 level. You’re not up here at the all-time high close that you had. Remember this is a weekly chart of just closes. You’re not there, but you also didn’t fall out of bed. Is there pressure on the market? There is. What’s going for gold is that tariffs are coming. High interest rates, still look like they’re here. We don’t look like we have a Fed that’s going to be accommodative in January to the marketplace, and the economic data that’s coming out hasn’t been terrible. You’re now going to start getting the new jobs data and everything starts again as the month gets going.
When you look at the bigger chart on a daily basis, we are certainly not here in the 28-and-a-quarter area. You’re now pressing back into the 26-and-a-quarter area. You know? I’m just giving you an example. You are down $200 an ounce, which gives the market an upside target. The pattern on the swing line: higher high, lower low.
Read the full article here



Leave a Reply