After surging dramatically in the last couple months, gold’s selloff risk is high. Massive recent buying not only catapulted gold deep into extremely-overbought territory, it exhausted gold-futures speculators’ likely capital firepower for buying. Couple that with October’s normal seasonal pullback, an oversold US dollar, and excessively-dovish Fed-rate-cut expectations, and gold is staring down a large pullback if not a correction.
Market trends are rarely linear for long, they naturally flow and ebb. Prices surge in bull-market uplegs, generating increasing popular greed. That soon sucks in all available near-term buyers, stalling upside progress. Then selling flares, forcing prices back down and rebalancing sentiment. Even the strongest uplegs are punctuated affairs, advancing two steps forward before stumbling one step back. Gold is no exception.
Over this past year gold has blasted higher in a monster upleg, soaring 46.8% at best over 11.7 months into late September! This remarkable rally has proven one of gold’s biggest and longest uplegs in decades. Bull uplegs are born after corrections or bear markets, 10%+ and 20%+ declines respectively. Uplegs remain alive as long as their periodic selloffs are sub-10% pullbacks, since larger corrections reset uplegs.
This current unusually-large gold upleg really accelerated since late July, surging 13.1% in 2.1 months. That compressed nearly 3/8ths of this upleg’s entire gains into less than 1/5th of its lifespan! The Fed launching a new rate-cut cycle was the main driver, first on hopes of the FOMC birthing it with a crisis-level 50-basis-point cut and later when that actually came to pass. That blasted gold to 13 nominal record closes!
The faster any upleg rallies and the higher it shoots, the greater the odds a material selloff is imminent. Ironically that’s when most traders least expect one, as bullishness soars with herd greed. The longer and stronger any upleg runs, the more traders assume it will continue indefinitely. So they rush to chase those mounting gains when they should be wary, biding their time and waiting for inevitable selling to buy lower.
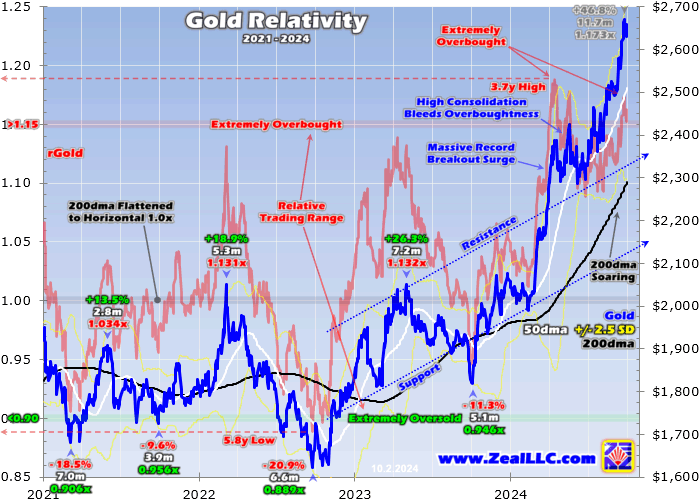
Overboughtness indicators measure how fast prices have surged, revealing when they get so stretched technically they are highly likely to mean revert lower soon. One simple gold-overboughtness construct divides gold’s closing price by its trailing 200-day moving average. Charted over time, this Relative Gold indicator tends to carve horizontal trading ranges. Gold just leapt back into extremely-overbought territory!
This chart effectively takes gold’s 200dma and flattens it to horizontal at 1.0x. The Relativity multiples oscillate around that, rendering the size and speed of gold moves in constant-percentage terms. In late September gold blasted up so far so fast that rGold stretched way up to 1.173x. Such rarefied levels are very unusual, and historically big-and-sharp selloffs usually immediately follow extreme overboughtness.
Over the past quarter-century since early 1999 encompassing the entire modern gold era, rGold levels over 1.173x have only been seen on 3.7% of all trading days. They are way rarer in gold’s current secular-bull phase which was born in mid-December 2015. Over the decade or so since, only 30 out of 2,211 trading days have seen 1.173x+ rGold levels making for 1.4%. Gold doesn’t get this overbought very often.
Yet the last time it happened wasn’t long ago in mid-April, when gold rocketed to 1.188x its 200dma on heavy buying from Chinese investors and central banks. Gold emerged from that one pretty unscathed, merely suffering a 4.0% pullback into late April followed by a second 5.7% one into early June. If foreign gold demand remains strong or American stock investors return, we could get lucky again this time around.
But before gold’s blistering spring surge, the last time such extreme overboughtness was seen was fully 3.7 years earlier in August 2020. That month gold’s last 40%+ monster upleg crested, after emerging from March’s pandemic-lockdown stock panic. Gold had rocketed 40.0% higher in just 4.6 months, a scorchingly-fast run. That actually left gold extraordinarily-overbought, peaking at an epic 1.260x its 200dma!
While gold can get more overbought than recently, such extremes are crazy-rare. Gold only exceeded 1.25x its 200dma on 0.8% of all trading days since early 1999, and only that single trading day over this past decade for 0.0%! And the reckoning after soaring too far too fast wasn’t pretty. Over the next 7.0 months into early March 2021, gold suffered a major 18.5% correction! Extreme overboughtness is very risky.
Yet if gold’s only problem today was stretching 17%+ above its 200dma in late September, I wouldn’t have bothered with this essay. As April 2024’s extreme-overboughtness episode showed, they can also be resolved with high consolidations. Rather than selling off hard to rebalance greedy sentiment and overextended technicals, gold drifts sideways to lower gradually bleeding them off. That could happen again.
Unfortunately gold faces a much-bigger challenge than extreme overboughtness. Gold’s powerful surge over the last couple months was largely driven by massive gold-futures buying. Speculators in that realm punch way above their weights in bullying around gold prices, due to the extreme leverage inherent in it. Each contract controls 100 ounces of gold, worth $265k at $2,650. But margin requirements are super-low.
Absurdly these traders are only required to keep $11k cash margins in their accounts for each gold-futures contract they trade. That makes for extreme maximum leverage to gold of 24.1x! Way up there every dollar deployed in gold futures has 24x the price impact on gold as a dollar invested outright. But the risks are insane, as a mere 4.2% gold move against specs’ positions wipes out 100% of their capital bet.
This next chart is far scarier than the last, looking at speculators’ overall gold-futures positioning in recent years. That data is only published weekly in the famous Commitments of Traders reports, current to Tuesday closes but not released until late Fridays. So the latest-available CoT data before this essay was published was as of September 24th. Gold surged to its latest nominal record of $2,662 that day.
Total spec longs are rendered in green, and total spec shorts in red. The former are proportionally more important for gold’s near-term price direction, as longs outnumbered shorts by an average of 3.5x over the last 52 CoT weeks. These hyper-leveraged speculators have thrown so all-in-bullish on gold that their longs are now in far-more-extreme territory than gold overboughtness, which is ominously-bearish for gold.
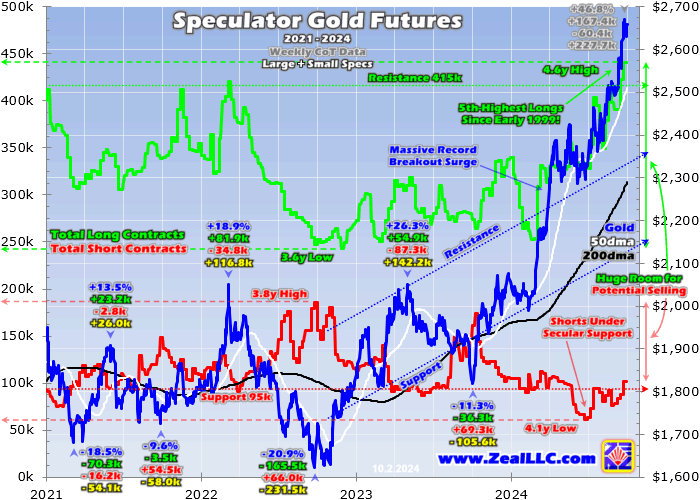
A major driver of gold’s monster 46.8% upleg since early October 2023 was speculators buying gold futures, sometimes aggressively. During that span specs added 167.4k long contracts, while their shorts fell by 60.4k. That huge 227.7k of combined buying has exhausted these traders’ likely capital firepower for buying. This is evident in the secular trading ranges of both spec longs and shorts, drawn in this chart.
Recent years’ support for total spec shorts has run around 95k contracts. Yet they recently fell well under that, to just 61.8k in late June 2024 which was a deep 4.1-year low! They did recover to 101.3k by this latest CoT report, but that was still just over secular support. This implies speculators aren’t likely to do much more short-covering buying. On the contrary, they have huge room to ramp selling slamming gold lower.
The scariest thing for gold heading into Halloween is way-more-important spec longs, which are super-high at 441.0k contracts. That’s their loftiest levels witnessed in 4.6 years, extreme rarefied territory well above their own 415k resistance! But the kicker is even worse. Out of all 1,343 CoT weeks since early 1999, this latest-reported one ranks as the 5th-highest spec longs on record! That’s extreme top 0.4%!
The only time total spec longs have ever been higher was between late December 2019 to late February 2020. During that anomalous span, fully 7 of the top-10 CoT weeks were hit including the all-time spec-longs record of 473.2k in mid-February. Back at the time I warned how dangerous gold’s peculiar surge was that exhausted specs’ buying firepower. Indeed in mid-March gold plummeted 12.1% in just 8 trading days!
That brutal collapse was fueled by enormous mean-reversion gold-futures long dumping over several CoT weeks. Granted that happened during the pandemic-lockdown stock panic, when the US dollar soared on enormous safe-haven buying. Yet the principle still stands. When total spec longs grow excessive relative to their own history, massive selling soon erupts to normalize those bets. That needs to happen again soon.
Futures trading is very different from most trading. When speculators add longs or shorts, they become legally-obligated to close out those positions by doing the opposite. Over the last seven CoT weeks alone, these traders added 91.7k long contracts! That hyper-leveraged buying was the primary driver of gold’s recent record-breaking surge. But now these guys have 92k new longs they need to unwind by selling.
If that 92k contracts of long buying catapulted gold from $2,388 to $2,662, the coming proportional gold-futures selling could force gold similarly lower. That was about $275 up, and a comparable $275 down would make for a 10.3% correction. Seeing sub-$2,400 gold soon wouldn’t be seriously damaging technically, but would wreak havoc on sentiment. The recent popular greed would fast give way to widespread fear.
Ultimately such mid-upleg selloffs are healthy, extending uplegs’ longevity and ultimate magnitude. They bleed off excess greed before it becomes upleg-threatening. Gold’s bull market is very much alive and well, so gold’s longer-term outlook remains really bullish following a necessary short-term pullback or correction. And there are a couple more factors arguing big mean-reversion gold-futures selling is imminent.
Speculators’ extreme leverage forces their gold-futures-trading time horizons to be ultra-myopic, days or maybe weeks. These traders look to the US dollar’s fortunes for their primary trading cues, doing the opposite. The benchmark US Dollar Index fell considerably during gold’s recent 13.1% surge since late July, down 3.7%. That has left the USDX pretty-oversold, increasingly due for a bigger bear-market rally.
The dollar in turn is often driven by traders’ expectations for the Fed’s interest-rate trajectory. That recent 50bp rate cut in mid-September to kick off a new cutting cycle was a surprise. That morning Bloomberg published a survey of Wall Street economists, with only 9 of 113 predicting the FOMC would go a crisis-level 50bp instead of the usual 25bp! That helped force the USDX to a 14.2-month low, which was quite oversold.
At that FOMC meeting, top Fed officials predicted another 50bp of additional cuts across 2024’s pair of remaining FOMC meetings. But as of mid-week, federal-funds futures were implying traders expecting fully 75bp of more cuts by the end of this year! That would require dismal major economic data, which isn’t likely. So sooner or later traders’ rate expectations have to be reined in to align with top Fed officials’.
October will likely see some key economic data on jobs or inflation print better than anticipated, slicing expected Fed rate cuts back to 25bp at each of the next two FOMC meetings. That will force the USDX higher on dollar-denominated yields not falling as fast as currently feared. And a sharp dollar bear rally is likely to spark big gold-futures selling, which will almost certainly snowball from these extreme spec-long levels.
The second factor arguing for the timing of gold’s overdue mean-reversion selloff coming sooner rather than later is seasonals. For decades gold has tended to suffer a seasonal selloff from late September to late October. That happens between gold’s autumn rally and winter rally, with the latter proving gold’s strongest seasonal rally by far. These brief seasonal headwinds may be sufficient to push selling over the edge.
But despite gold’s short-term selloff risks, its longer-term outlook remains really-bullish. Chinese investors and central banks are still big buyers by most accounts, and Indian demand is surging for this year’s key wedding season. Most importantly of all, American stock investors have barely even started chasing this monster gold upleg yet! Distracted by the AI stock bubble stealing the limelight, they’ve ignored gold.
Gold’s last two monster uplegs both crested in 2020 at 42.7% and 40.0% gains. Those were largely fueled by huge differential buying of gold-ETF shares by American stock investors. During those spans, GLD+IAU gold-bullion holdings rocketed up 30.4% or 314.2 metric tons and 35.3% or 460.5t! Yet utterly astoundingly during gold’s current 46.8% monster upleg, GLD+IAU holdings somehow fell 2.4% or 30.1t!
Such an anomaly is unprecedented in this modern gold-ETF era, and can’t last. Sooner or later gold will have rallied high enough for long enough to attract back American stock investors and their vast pools of capital. Their coming buying will supercharge gold, driving its prices much higher. So this overdue selloff from extreme overboughtness on excessively-bullish spec gold-futures positioning is a short-term speed bump.
These inevitable periodic retreats should be embraced, offering the best buy-lower opportunities seen in ongoing uplegs and bulls. That’s especially true in gold miners’ stocks, which tend to amplify their metal’s material price trends by 2x to 3x. The gold stocks are forging higher, on the verge of reporting their best quarterly results ever! Their record profits and huge earnings growth are unparalleled in all the stock markets.
Even though gold stocks remain way undervalued relative to prevailing gold levels, even though they have really lagged gold’s monster upleg, they will still get sucked into any gold pullback or correction. They will almost certainly leverage gold’s downside, although not as much as if they had fully amplified this huge upleg. Actively trading gold stocks as gold flows and ebbs has proven quite lucrative for decades.
As of the end of Q2’24, we’d realized 1,510 newsletter stock trades since 2000. They all averaged 15.6% annualized realized gains over that long quarter-century span, roughly double the long-term stock-market average! And as of early September, our newsletters have realized 54 stock trades in 2024 averaging 31.1% annualized gains! This volatile high-potential contrarian gold-stock sector is eminently tradable.
Successful trading demands always staying informed on markets, to understand opportunities as they arise. We can help! For decades we’ve published popular weekly and monthly newsletters focused on contrarian speculation and investment. They draw on my vast experience, knowledge, wisdom, and ongoing research to explain what’s going on in the markets, why, and how to trade them with specific stocks.
Our holistic integrated contrarian approach has proven very successful, and you can reap the benefits for only $10 an issue. We extensively research gold and silver miners to find cheap fundamentally-superior mid-tiers and juniors with outsized upside potential. Sign up for free e-mail notifications when we publish new content. Even better, subscribe today to our acclaimed newsletters and start growing smarter and richer!
The bottom line is gold’s selloff risk is high. Surrounding the Fed’s outsized rate cut, gold recently blasted up to extremely-overbought levels. Those big-and-fast gold gains were mostly fueled by massive gold-futures buying. Speculators flooding in catapulted their overall positioning to exceedingly-rare extremes. Total spec longs have only seen a handful of higher weeks ever, immediately preceding sharp gold selloffs.
Excessive spec longs have to soon be unwound by proportional selling, which cascades hammering gold lower. The timing of this inevitable mean-reversion gold-futures dumping is likely imminent. The US dollar is quite oversold and due to bounce on moderating Fed-rate-cut expectations, and gold has weak October seasonals. Gold’s healthy selloff will prove an excellent opportunity to add great gold stocks cheaper.
Adam Hamilton, CPA
October 4, 2024
Copyright 2000 – 2024 Zeal LLC (www.ZealLLC.com)
Read the full article here







Leave a Reply