It seems the best we can hope for on the inflation front is a CPI report “in line with forecasts.”
The mainstream media was giddy, and the markets responded positively to the November CPI report because every metric came in as expected.
But the report wasn’t good – at least it wasn’t if you’re hoping for some relief from rising prices.
The CPI data indicates that we’re stuck on inflation.
Nevertheless, the report seemed to cement expectations that the Federal Reserve will once again cut interest rates at the December meeting. According to the CME Group’s FedWatch measure, the odds of a December cut rose to 99 percent after the CPI data came out Wednesday.
A Goldman Sachs Asset Management analyst told CNBC, “In-line core inflation clears the way for a rate cut at next week’s meeting,” and speculated that “the Fed will depart for the holiday break still confident in the disinflation process.”
My question is: what disinflation process?
The November CPI Data
According to the latest Bureau of Labor Statistics data, prices rose 0.3 percent month-on-month in November. That nudged the headline annual CPI to 2.7 percent, up from 2.6 percent in October and 2.4 percent in September.
Stripping out more volatile food and energy prices, core CPI also rose 0.3 percent on the month. On an annual basis, core CPI came in at 3.3 percent. That was the same reading as last month and still far above the mythical 2 percent target.
In other words, there was no decline in core CPI, indicating no sign of “disinflation.”
It was the fourth straight 0.3 percent monthly increase in core CPI. If you annualize that monthly gain, you get an annual core CPI of 3.6 percent.
And looking back, core CPI was lower, at 3.2 percent, in August.
Keep in mind that the CPI doesn’t tell the entire story of inflation. The government revised the CPI formula in the 1990s so that it understates the actual rise in prices. Based on the formula used in the 1970s, CPI is closer to double the official numbers. So, if the BLS was using the old formula, we’re looking at CPI closer to 6 percent. And using an honest formula, it would probably be worse than that.
Looking more closely at the numbers, we find that falling energy prices continue to skew the CPI lower. Gasoline prices have dropped over 8 percent in the last year, and the broader energy index is down over 3 percent.
But on a monthly basis, prices rose in every category last month except energy services, utility gas services, and medical care commodities.
Food prices rose 0.4 percent during the month, and shelter costs rose another 0.3 percent.
The Fed Is Already Creating More Inflation
Despite sticky inflation, the Federal Reserve is aggressively loosening monetary policy.
In other words, the central bank has surrendered to inflation.
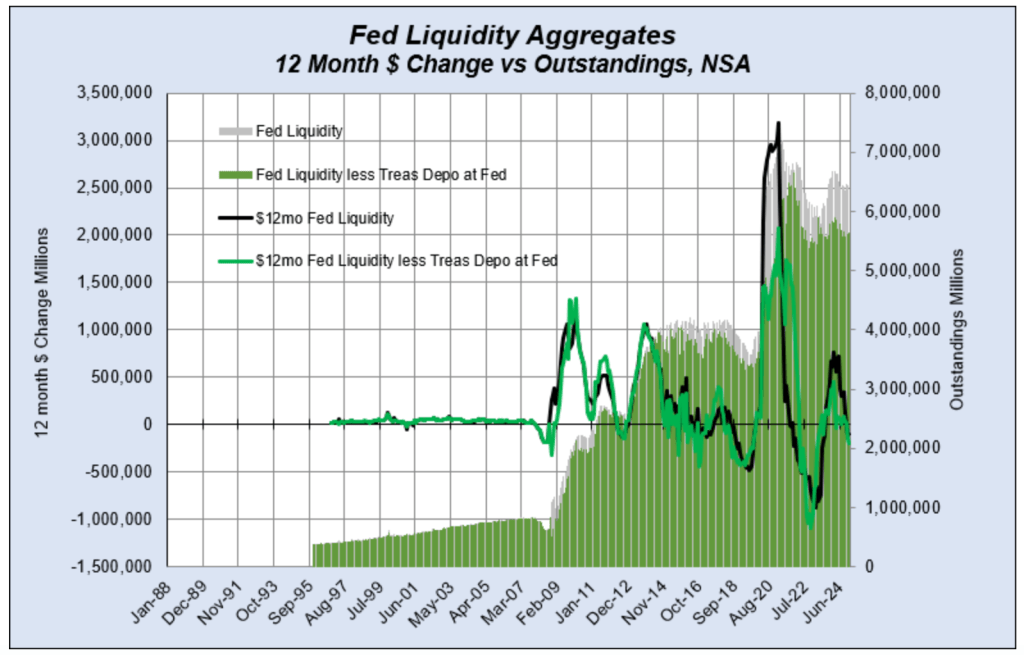
In fact, the central bank started loosening monetary policy when it quietly announced that it would begin to taper balance sheet reduction in June.
Keep in mind what this pivot to rate cuts and the wind-down of balance sheet reduction actually means – the Federal Reserve is ramping up the inflation machine even as it declares victory over inflation. It means more credit expansion and more money flowing into the economy.
In other words, by declaring victory over price inflation and easing its monetary policy, the Fed is effectively committing to creating more inflation.
We can already see the results in the money supply.
Properly defined, inflation is an increase in the supply of money and credit. Price inflation is one symptom of this monetary inflation.
And the money supply is growing.
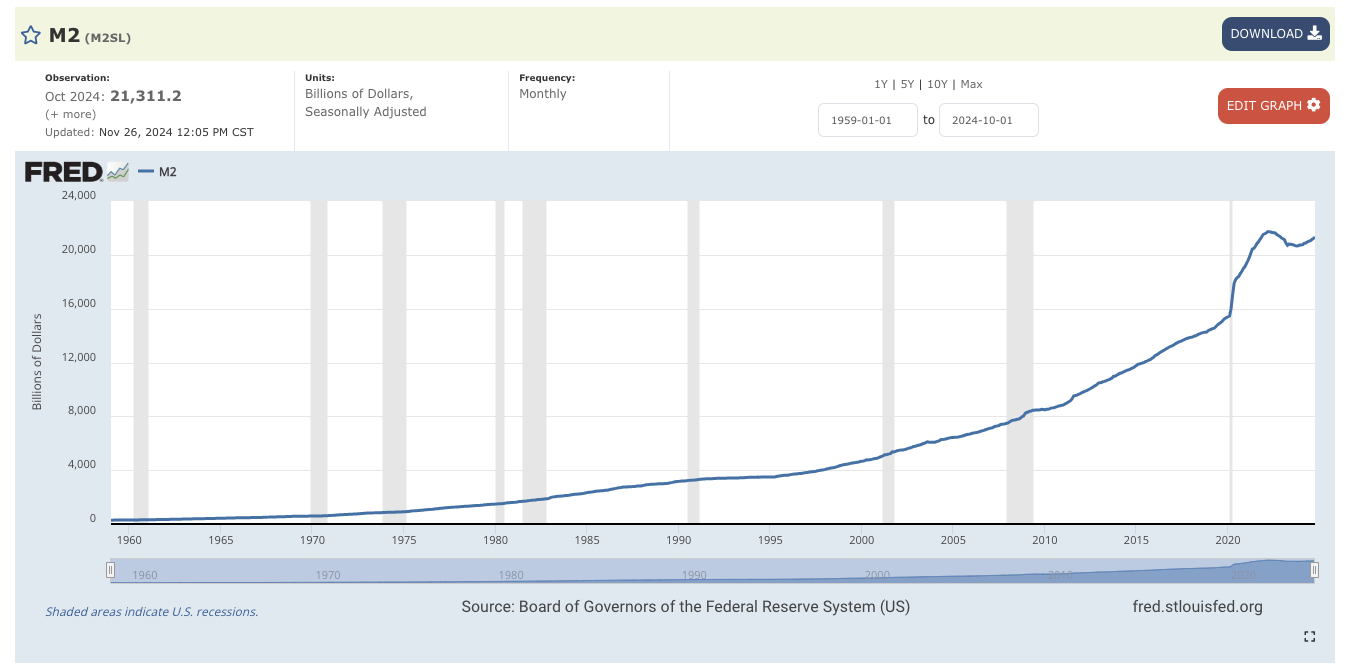
The M2 money supply bottomed a little over a year ago at $20.60 trillion. Since then, it has crept upward. As of October, it was at 21.3 trillion. That’s the highest level since December 2022.
 The money supply has grown year-over-year for seven straight months.
According to the Chicago Federal Reserve’s National Financial Conditions Index, financial conditions are already historically loose. The NFCI decreased to –0.65 in the week ending December 6. A negative number indicates loose financial conditions.
As the Federal Reserve raised interest rates and shrunk its balance sheet, the money supply contracted sharply. In fact, it was the largest decline in the money supply since the Great Depression.
While this might seem impressive, it barely put a dent in the massive expansion of the money supply in the years after the 2008 financial crisis and during the pandemic. As Mises Institute senior editor Ryan McMaken noted, the recent contraction of the money supply “only puts a small dent in the huge edifice of newly created money.”
In other words, as aggressive as the Fed’s rate-cutting and balance sheet reduction was, it was a teardrop in the ocean compared to the amount of inflation created during the pandemic, not to mention in the wake of the 2008 financial crisis and Great Recession.
It’s also notable that drops in the money supply usually precede recessions, but as McMaken pointed out, “Recessions tend not to become apparent until after the money supply has begun to accelerate again after a period of slowing. This was the case in the early 1990’s recession, the Dot-com Bust of 2001, and the Great Recession.”
The resurgence of money supply growth is, by definition, inflation. We are already seeing the result as stock market values increase. Whether this new round of inflationary activity finds its way into consumer prices remains to be seen, but the stickiness in CPI is cause for concern.
Read the full article here


Leave a Reply