“Gold’s Contra-Trend Rally; S&P’s Earnings(less) Tally“
Let’s begin with Gold, courtesy of the “We Love It When We’re Wrong Dept.” given price having just recorded its best week (by net points gained) in nearly 45 years!
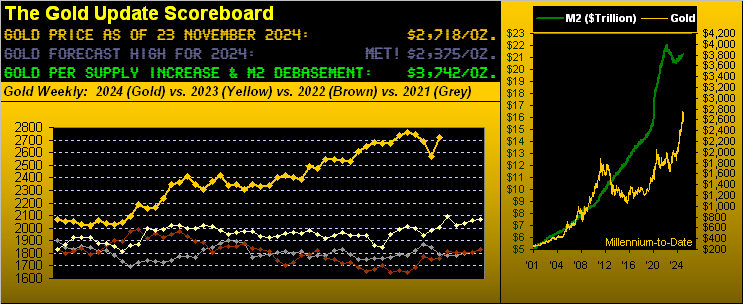
For following last week’s piece (“ ‘Tis No Surprise, Gold’s Current Demise “) replete with our “…suggesting Gold revisiting the upper 2400s on this run…”, Gold instead posted five consecutive up days toward settling yesterday (Friday) at 2718. Not only was it a beautiful “thAng”, but it also lends credence to our time-honoured quip that “Shorting Gold is a bad idea”.
Still — speaking of Short — the week’s five-day rally was not sufficient to flip the fresh parabolic Short trend on Gold’s weekly bars back to Long per this next graphic. Indeed to so do in the ensuing week, price would need eclipse the 2797 level as below shown. ‘Course as we’ve stated of late, Gold’s prior three weekly parabolic Short trends lasted but three weeks apiece. And as fresh as is the new Short trend, nonetheless, ‘twas a terrific week for the yellow metal. Price’s net gain on a percentage basis of +5.9% was the best since that ending 17 March 2023 — and by the net gain of +151 points — ’twas Gold’s best week since the “Wonder Week” ending 18 January 1980 upon price gaining +195 points from 628 to 823 (+31%). A lot of today’s financial “pros” weren’t around then (and it shows) … yet we were, (as too, for you Silver buffs, were Nellie, Willy and Lamar Hunt … but we digress). Here’s the year-over-year graphic:

How wonderful to have been wrong, indeed! And yet — until the weekly parabolic trend whirls back up to Long — we’ve entitled this past week’s fabulous rise as a “contra-trend rally”, (which for you WestPalmBeachers down there means Gold is rising within a broader down trend). To wit, this next two-panel graphic is gleaned from what we refer to as our best Market Rhythms. On the left is Gold by the day since 22 October: notice the MACD (moving average convergence divergence) has just crossed to positive. On the right, however, is Gold by the week since 06 June: therein (as we first presented last week) the MACD had just crossed to (and remains) negative.
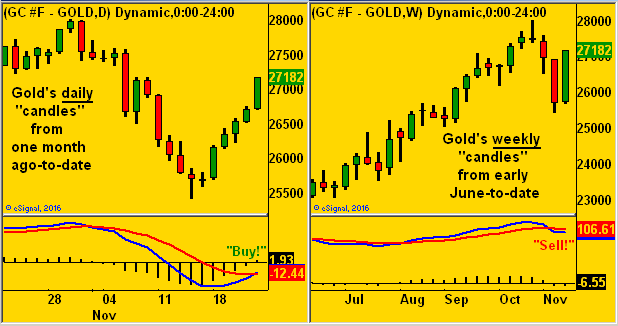
“So which one is up, mmb?”
Well, Squire, ultimately both! But for the present, the ensuing week brings the Federal Reserve’s so-called favourite gauge of inflation: Core Personal Consumption Expenditures Prices for October. And the consensus there is it continues to run “hot” at an annualized pace of +3.6% which obviously surpasses the Fed’s ongoing target for +2.0%.
Too, there’s nearly four weeks to go before the Open Market Committee’s next Policy Statement (18 December), prior to which we’ll get the U.S. Bureau of Labor Statistics’ read on November inflation at both the retail and wholesale levels. And should those metrics not be benign, does the Fed, rather than again cut its Funds Rate, leave a lump of coal in our Christmas stocking? That would likely be a Gold negative.
Still, from the contra-trend conflict comes the website’s updated Market Value chart for Gold from a year ago-to-date. When last herein viewed a week ago, price had negatively crossed beneath its smooth valuation line (borne of price movement relative to the five primary BEGOS Markets, i.e. the Bond Euro / Gold / Oil / S&P 500), the “rule of thumb” there to expect further price decline. But from the “Hold Your Horses! Dept.”, price this past week reversed course upward to positively cross back above the smooth valuation line. Nothing like seeing broadly undervalued Gold getting the bid! Here’s the graphic:
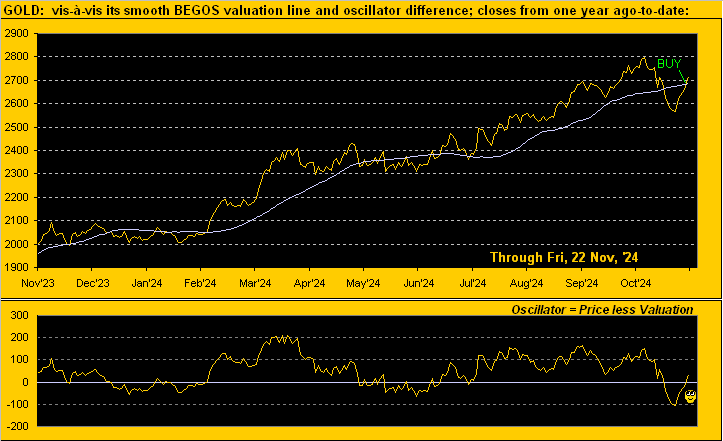
“But why the sudden turnaround, mmb?”
Squire, for all the usual “conventional wisdom” reasons, depending upon one’s media source. “Oh there’s geo-political tension favoring safe-haven Gold!” “Oh Bitcoin is pulling Gold higher ’cause Trump’s gonna pair ’em!” “Oh Goldman Sachs says Gold $3,000!” We’ll stick with the foundational truth: currency debasement, even as nothing moves in a straight line. To be sure, 1,132,033 December Gold contracts were purchased last week … meaning 1,132,033 were sold.
Meanwhile, speaking of Bitcoin, its December futures contract hit an all-time high yesterday of $101,100. Come 27 December is the contract’s expiry, which unlike Gold is settled financially rather than physically, (just in case you’re scoring at home and think you have to make delivery of Bitcoin). “Hey Mabel! I thought you said you stacked it up in the closet!”
Not scoring as well at present is the Economic Barometer. This past week brought but eight metrics into the Baro, only three of which improved period-over-period. Notable amongst the retreaters was the lagging indicator of the Conference Board’s Leading Indicators for October. The negative reading was, of course, warmly greeted by the S&P, which then spent the balance of Thursday and Friday moving higher, “because the Fed has to cut, ya know.” Yeah, we know. “Got Gold?” Here (featuring some old “friends”) is the Econ Baro along with the S&P 500 from one year ago-to-date:
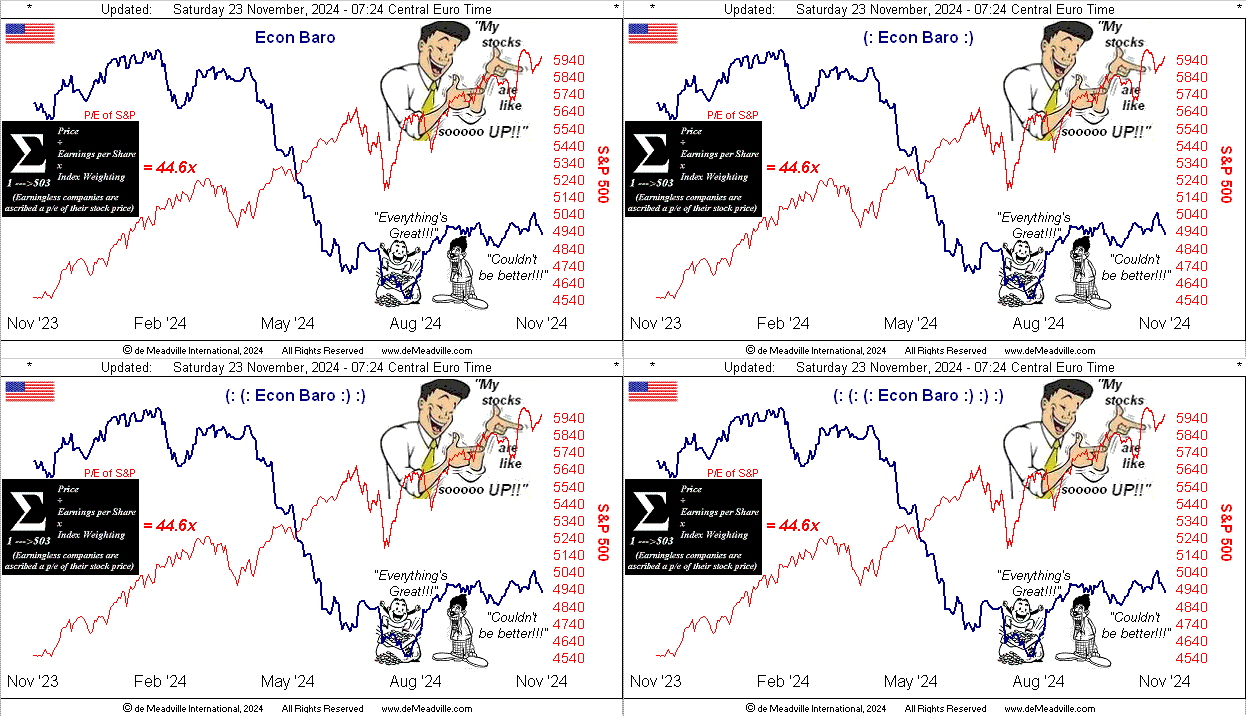
And of course as has been our wont seemingly forever, the “live” price/earnings ratio of the S&P 500 remains hideously high, now 44.6x. It stays in such silly territory because as the S&P trades higher, earnings don’t keep pace.
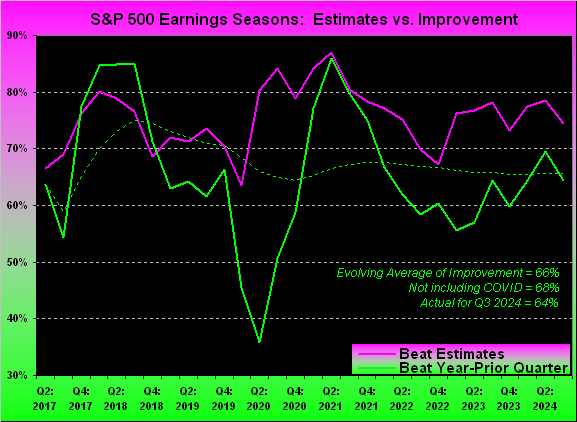
Indeed, Q3 Earnings Season just concluded. Of the S&P’s 503 entities, 447 reported within the seven-week stint. 64% of the bottom lines bettered themselves over Q3 of a year ago … which means 36% did not … which makes us wonder why they’re even in the world’s wealthiest index … which brings us to the following graphic.
It covers the last 30 quarterly Earnings Season for the S&P. The violet line is the percentage of companies beating the broker’s marketing tool known as “estimates“. The green line is the percentage of companies that actually made more money, (an aspect seemingly taboo for the broker to reveal). And as for the dashed green line, ’tis the evolving average of percentage improvement from the prior year’s like quarter. That average today is 66%. Exclude COVID year 2020 and the average is 68% … which is why we’ve been regularly characterizing this past Earnings Season as “sub-par” … which is why the high P/E refuses to die … which is why our title includes “The S&P’s Earnings(less) Tally”, indeed. Take heed:
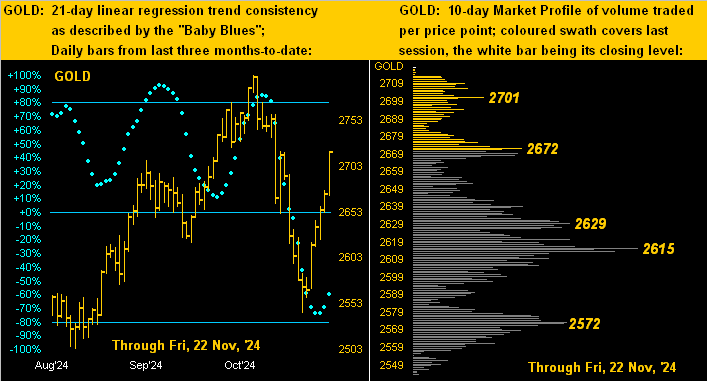
Take heed, too, over Gold’s contra-trend rally. ‘Twould be statistically off the end of the Bell Curve for Gold to record a further consecutive weekly parabolic Short trend of just three weeks duration. That noted, one cannot argue with the following two-panel display featuring Gold’s daily bars from three months ago-to-date on the left and 10-day Market Profile on the right. Gold’s “Baby Blues” of linear regression trend consistency now curling upward without having quite reached down to their -80% axis is quite the bullish suggestion. And per the Profile — atop which Gold sits — there are plenty of high-volume support prices as labeled:
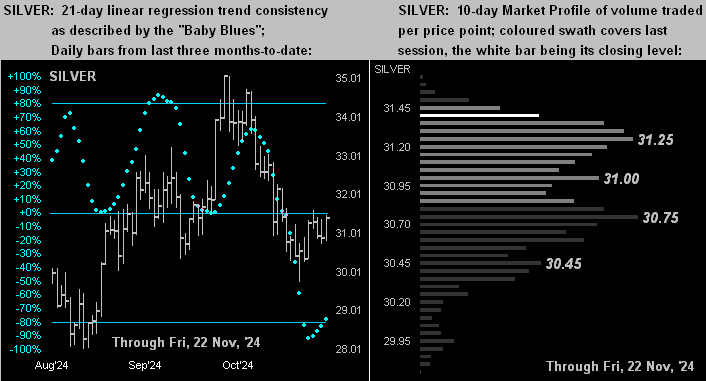
Hardly as firm as that for Gold is the like picture for Silver. Save for last Monday, her trading week at best was rather namby-pamby, albeit her “Baby Blues” (at left) piercing up through the -80% axis typically is a “buy” signal. And per her Profile (at right) there is labeled volume support from 31.25 down to 30.75. Further — as we relentlessly remind — Silver remains ever so cheap relative to Gold: the century-to-date average Gold/Silver ratio is now 68.6x, whereas the actual ratio settled the week at 86.6x. Thus with Gold at 2718, Silver by the ratio’s average “ought be” +26% higher at 39.64 rather than her actual present price of 31.41. Again: do not forget Sister Silver!
So into the StateSide Thanksgiving week we go: 11 metrics come due for the Econ Baro, including 10 packed into Monday through Wednesday, the PCE data surely to get the lion’s share of interest.
Moreover: we’ve this heads-up for next Saturday’s edition of The Gold Update. We shall be once again “in motion”, this time through the treasured beauty of Tuscany. Thus akin to the occasional “Gold in 60 Seconds”, next week’s piece shall be quite brief. True, ’tis is a month-end edition, normally graphics-rich. However, we’ll like save most of those for the ensuing 07 December missive. Either way, Gold’s reaction to next Wednesday’s PCE shall be key.
As we thus prepare to embark for Golden Tuscany, ensure your tally totals a Golden Destiny!

Cheers!
…m…
www.TheGoldUpdate.com
www.deMeadville.com
and now on “X”: @deMeadvillePro
Read the full article here





Leave a Reply