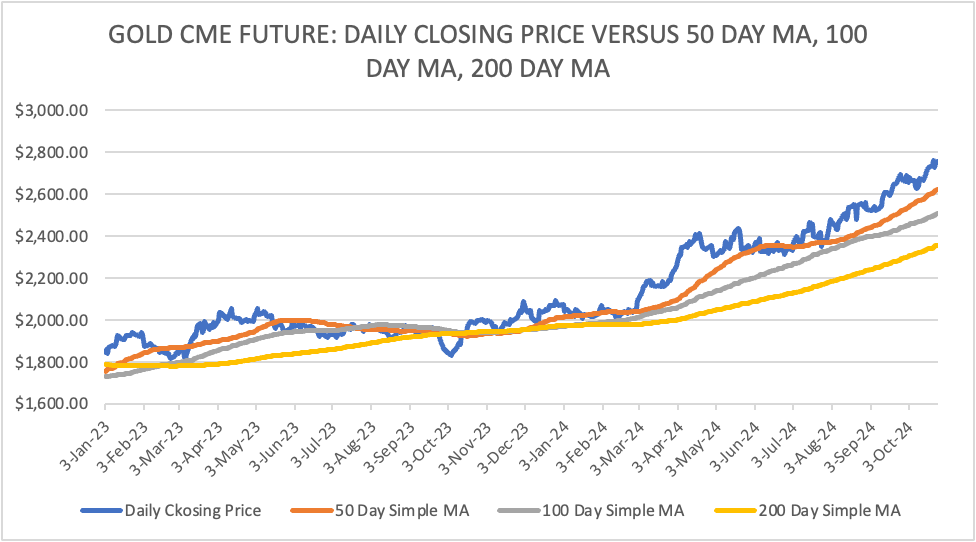
- The above chart is a comparison of Daily Closing price versus 50 day simple MA, 100 day simple MA and 200 day simple MA.
- Time period: 3rd January 2023 to 25th October 2024
Conclusions from the above:
- Gold has traded over 100 day simple ma and 200 day simple ma after February 2024 and after which the big bullish trend began.
- In a long term bullish trend, gold has to trade over 100 day simple ma and 200 day simple ma.
- Convergence or converging trend of 100 day ma and 200 day ma sometimes suggests that an incoming short term sell off and even a short term bearish market.
- 50 day simple moving average has been flirted. Short term investors and/or investors with large open positions need to keep a close watch on end of the day 50 day simple moving average for stop losses and profit taking and/or risk reduction.
- Gold needs to trade over 50 day simple moving average to be in a short term bullish trend.
|
DAILY SIMPLE MOVING AVERAGE |
||||
|
|
50 DAY |
100 DAY |
200 DAY |
400 DAY |
|
COMEX FUTURES |
|
|
|
|
|
|
|
|
|
|
|
GOLD |
$2,622.00 |
$2,508.60 |
$2,357.00 |
$2,166.80 |
|
SILVER |
$3,095.00 |
$3,015.00 |
$2,800.00 |
$2,590.00 |
|
COPPER |
$432.20 |
$432.60 |
$425.60 |
$402.55 |
|
NYMEX CRUDE OIL |
$71.60 |
$75.37 |
$77.30 |
$77.50 |
|
PLATINUM |
$979.60 |
$978.60 |
$961.80 |
$962.10 |
- Short term trading/investing decision has to be on the ability/inability to trade over fifty day simple moving average.
- Investment for over three months to year need to focus the one hundred day moving average.
- Simple moving average need not be checked every day (except for intraday trading). A check at the end of the week can give good investment/trading strategy.
- Till the end of 2025, in view it will be very difficult for near dated gold future to fall below two hundred day simple moving average of $2357.00.
- Silver, should be very wild till end of 2025. A never before bullish sentiment seen in history for silver. If global stock are in a short term bearish trend, (due to unknown factors), then silver has twenty percent change of testing four hundred day moving average of $2590. But the same should be a touch and go.
- Silver can test two hundred day simple moving average of $2800 between February and May 2025, if (i) Global stock markets plunge and/or (ii) There is a general sell off in precious metals space. But once again fall (if any) will not be for long time.
- Very narrow price consolidation can be followed by unexpected crash or an unexpected big rise. Be very careful when price consolidates (in gold and silver) for over seven continuous trading sessions. Most the trading losses are seen on big breakdown days or big breakout days. Use higher stop losses but we need to say a big no to trading/investing in CME futures without a stop loss. No stop loss – No Trade should be the motto.
- Copper traders need to keep a close watch at two-hundred-day simple moving average till February 2025. Inability/Ability to trade over two hundred day simple moving average will decide the trend. (short term and medium term).
- Long term copper traders and physical dealers need to keep a close watch at four-hundred-day simple moving average.
- Crude oil will break free from $60-$80 trading range and form a new range. Get ready for a new trading range in crude oil anytime soon.
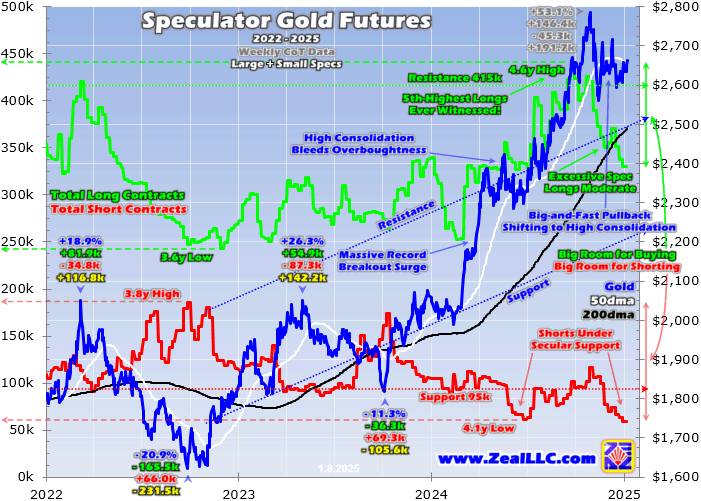
HYPER BULLISH SENTIMENT FOR GOLD/SILVER! WHAT CAN CAUSE A SELL OFF?
- Peace in middle east or Ukraine war.
- Plunge for a few weeks in US stock markets.
- Central banks stop increasing physical gold reserves. (Highly unlikely but any such news or speculation, can cause a short term sell off.)
- Chinese people stop investing in gold/silver and switch to Chinese equities.
- Sharp rise in US dollar index.
- Long pause in interest rate cut by the Federal Reserve. (highly unlikely as of now.)
- Slower pace of rise of gold and silver can reduce the short term hot money in bullion. Gold and silver is being treated like a casino by short term bulls. If and when these casino traders start getting constant losses (on their buying positions) then then there can be some short term sharp correction.
- A three continuous trading fall will be called correction in my view. A continuous falling trend for twenty five trading sessions will be called a medium term bearish trend.
SILVER: CLOSING PRICE VERSUS 50 DAY SIMPLE MA, VERSUS 100 DAY SIMPLE MA, VERSUS 200 DAY SIMPLE MA. 
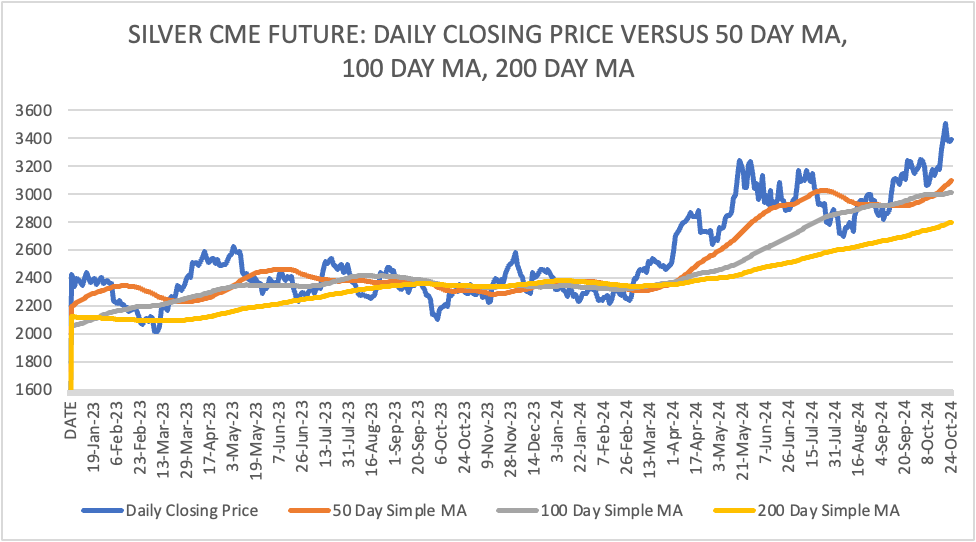
- The above chart is a comparison of Daily Closing price versus 50 day simple MA, 100 day simple MA and 200 day simple MA.
- Time period: 3rd January 2023 to 25th October 2024
Conclusions from the above:
- Convergence of 50 day ma, 100 day ma, 200 ma (all three) needs to be looked very seriously if and when they happen. Unthinkable rise or an unthinkable crash. Nothing in between.
- Better to trade intraday (in near dated cme silver future) when there is a convergence between 50 day ma, 100 day ma and 200 day ma. (all three).
- Even now there is a convergence between 50 day ma and 100 day ma. One needs to keep a close watch on 50 day ma and 100 day ma in case there is a falling trend over the coming weeks and coming months.
- Silver is a great long term investors. Short term investing in silver is not for everyone as it involves very high stop losses. Traders who have a natural tendency to trade without stop losses should avoid silver futures and opt for gold instead.
- Silver is very good for intraday trading only if you buy/sell on technical prices and that too with a strict stop loss. If the technical buy/sell price does not come any day, do not trade in silver that day.
TRADING LESSONS OF 2024
- It is your money.
- Capital protection should be the motive.
- Do not treat commodity future as a casino.
- Zero-Hero type trades is not recommended by me.
- Emotions does not give you profit and/or capital protection.
PRICE FORCAST FOR 2025
Gold near dated future:
Till end January 2025: Gold has to trade over $2672 on daily closing basis to be in a short term bullish zone and rise to 2981.00, $3122.70 and more. (i) Crash or sell off will be there if gold February does not break $2981.00 by 16th December close to Rs.2672.00, $2622.10, $2572.00 and more.
A daily close below $2672.00 for a minimum ten continuous trading sessions is needed for gold to be a short term bearish zone.
Till end May 2025: February 2025 to May 2025 can really test the bullish trend of gold. I will be extra cautious in my gold investment. There can be two to three big crashes between February 2025 to May 2025. (Gold April future and Gold June future can see this action.). Gold June can crash or be in a medium-term bullish zone if $3122.00 is not broken by end May (2025) to 2572.00, $2387.30 and more.
November 2024 to December 2025: Gold can rise to $3235.00 and $3716.60 as long as it trades over $.2527.00. A ten percent fall is always a part and parcel of the long term bullish trend. A sustained fall below ten percent (from a long term perspective) generally results in traders switching away from gold to other asset classes.
Silver near dated future:
Till end February 2025: Silver has to trade over $3500.00 to continue its rise and target $3723.00, $3931.20 and $4099.00 and more. Overall silver is bullish as long as it trades over $3000.00-$3050.00. On a safer side I will prefer to look at the ability/inability to trade over $3500.00 to decide on short term investment.
A daily close below $3280.00 for a minimum ten continuous trading sessions is needed for silver to be a short term bearish zone or see a big sell off.
Till end June 2025: History says that silver has seen a mind blowing price crash between March to June any year. There can be a big twenty percent price fall (from the highs) between March 2025 and June 2025. The crash does not last long, a single day to a week. All stop loss get triggered when it happens. A lot of traders are caught getting short on the lowest price. Be very careful between March 2025 and June 2025 on buying positions in silver. I am just sharing my experience. History may or may not repeat itself next year.
200 day simple moving average (based on previous day closing price) needs a close watch in the first six months of 2025.
November 2024 to December 2025: Silver can rise to $4810.00 and 5688.00 by December 2025 as long as it trades over 2677.00. Twenty percent fall to twenty five percent fall (from the highs), in my experience is a part and parcel of the long-term bullish trend. Silver investing is not for everyone, despite all the hyper bullish media hype. It is your money. Be sensible to make right investment choices.
Bets will be done for silver to rise and break past $5000.00 in the next eighteen months. Overall there will be buyers (physical, futures, ETF and all new ways to invest in silver) as long as it trades over $2500.00. We may even see $2500-$5000 wider trading range in the next twelve months. On a personal level, I expect silver to break past $5000 without any major medium term bearish trend. But do not blindly invest in silver looking at $5000 price target as I am also prepared to average my silver investment in case there is a price fall below $2500.00. Ask your self are you ready to bear an MTM loss of $2500.00. If not then be a day trader and short term investor in silver.
DIWALI GREETINGS TO EVERYONE.
Disclaimer
- The investment ideas provided is purely independent view point and are solely for collective learning and for academic interests. There is no commercial benefit accruing or have deemed to accrue to me out of providing such investment ideas.
- The investment ideas shared here cannot be construed as investment advice or so. If any reader is acting on these advices, they are requested to apply their prudence and consult their financial advisor before acting on any of the recommendations made here. I am not responsible to anybody in the event of profits and losses (if any) upon acting on such advice.
- I hope that our reader is aware about this well aware of the risk involved in trading in commodity derivative trading.
Disclosure: I trade in India’s MCX commodity exchange. I have open positions in India’s MCX commodity future. I do not trade in CME future or OTC spot gold and spot silver.
NOTES TO THE ABOVE REPORT
- ALL VIEWS ARE INTRADAY UNLESS OTHERWISE SPECIFIED
- Follow us on Twitter @chintankarnani
- PLEASE NOTE: HOLDS MEANS HOLDS ON DAILY CLOSING BASIS
- PLEASE USE APPROPRIATE STOP LOSSES ON INTRA DAY TRADES TO LIMIT LOSSES.
- THE TIME GIVEN IN THE REPORT IS THE TIME OF COMPLETION OF REPORT
- ALL PRICES/QUOTES IN THIS REPORT ARE IN US DOLLAR UNLESS OTHERWISE SPECIFED.
- ALL NEWS IS TAKEN FROM REUTERS NEWSWIRES.
- TECHNICAL ANALYSIS IS DONE FROM TRADINGVIEW SOFTWARE
Read the full article here







Leave a Reply