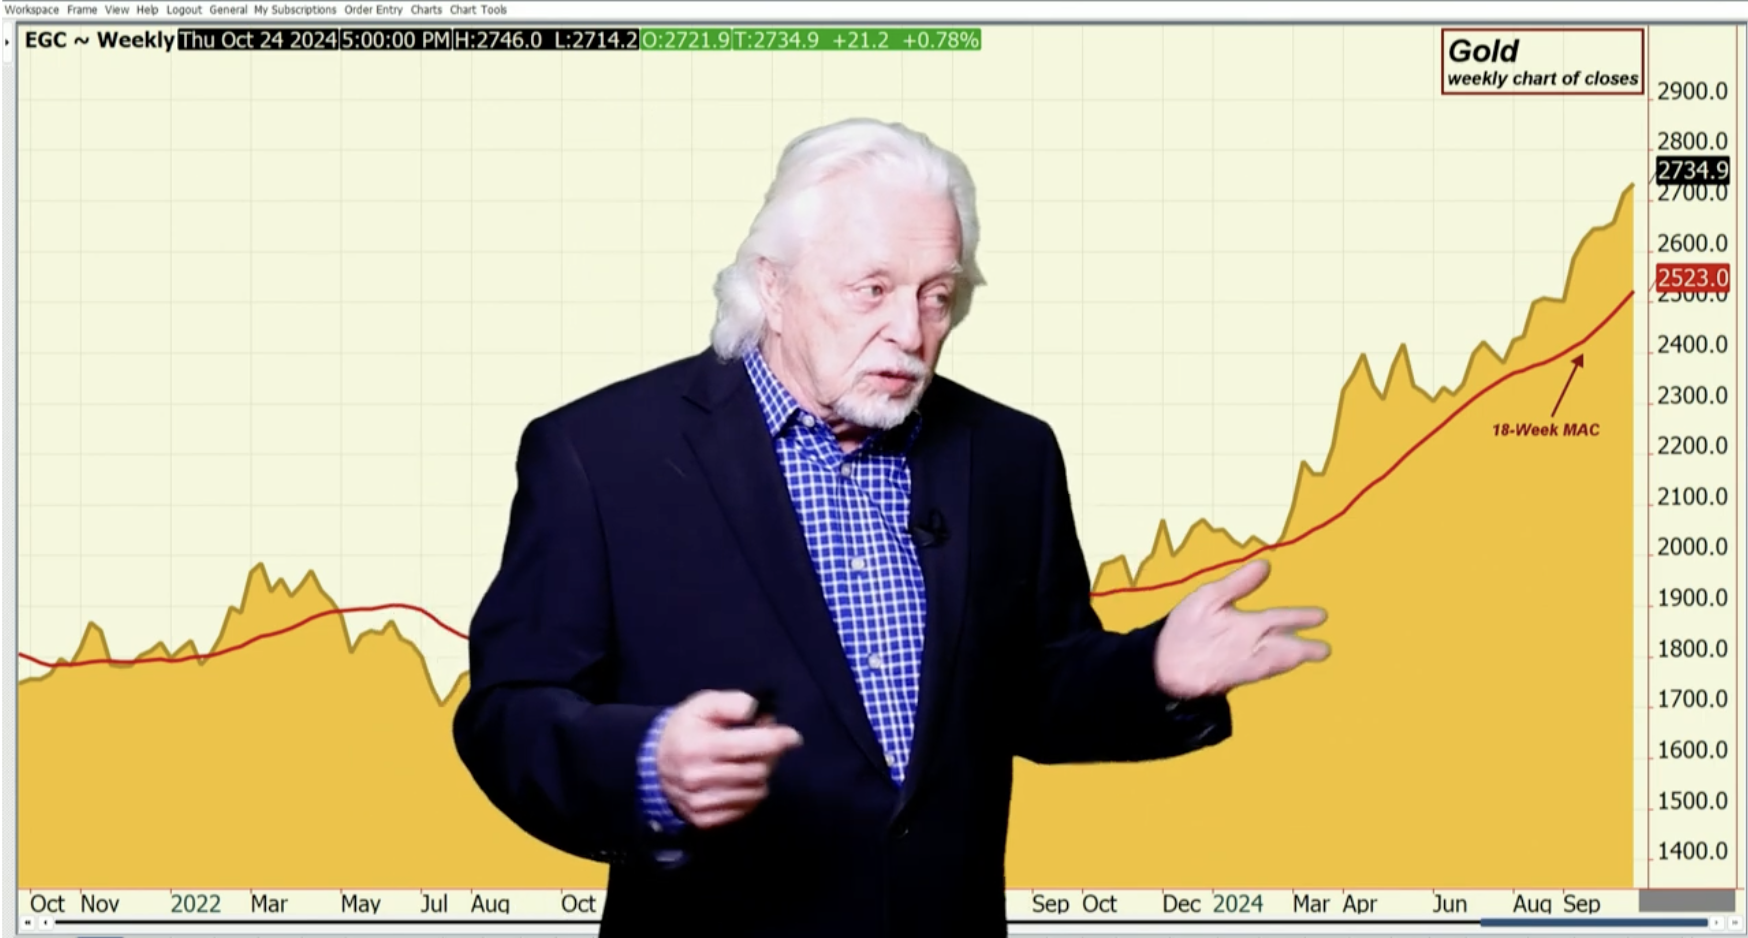
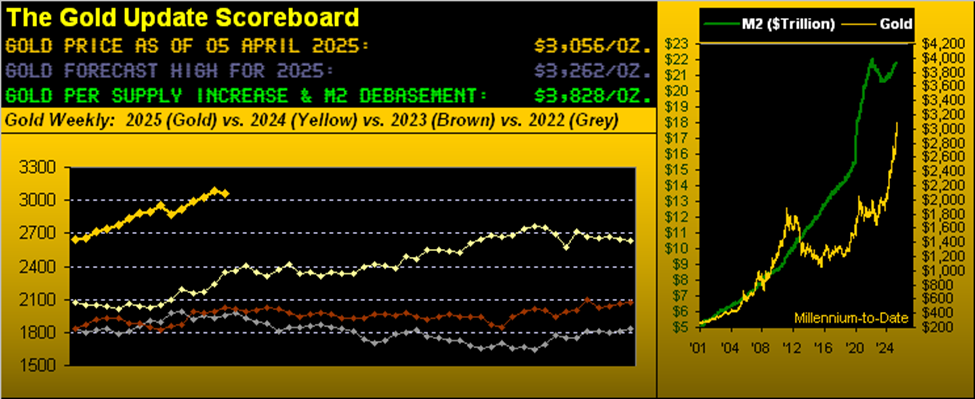
When we look at the gold market, we can see that if the market finished right here, it’s an all-time high close on a weekly basis. So, as I said, the Market’s acting pretty darn good. When you come over to the chart here, you had this big reversal day, two days ago. The question is, can the market get through that or was that a pause in the momentum? Generally speaking, that type of formation is a pause. You get higher lows and higher highs; you’re still in the bull can. The market is at this point staying over the 18-day average of closes.
Support would come in, I think if it went down there at the $2693 level. The resistance is pretty crystal clear it’s the upper Bollinger Band…and the momentum, this is what you got to keep your eye on now. You cannot count today, because today, we don’t know where it’ll finish. But we can certainly go on… Both numbers were over and the day before, you have what’s called the embedded reading. This means, on this pullback until the red line closes underneath 79, I say that the trade is buying the market and looking to attack the Bollinger Band again and that could be $30/40 from this area, so it’s something to watch.
Read the full article here


Leave a Reply